Generating logs for CUCM, SIP, or networking in general can be hard
Often when working with Cisco TAC (support) you’ll be asked to “pull trace logs” or perform a “packet capture”. This can often mean setting up a device that can capture packets on each end of the conversation, and actually capturing the ones and zeros between each endpoint (starting and stopping the capture at the same time on each end). This process can be quite frustrating, as you’ll usually need to have two devices built to do the capturing, and you’ll have to configure some network switchports to mirror the traffic (i.e. copy packets going to a phone or gateway to the packet capture device). Luckily, there is a better way.
What is RTMT
RTMT or Cisco Unified Real Time Monitoring Tool is designed to help manage and monitor a Cisco Callmanager cluster. RTMT can be installed on your local PC by going to CM Administration -> Application -> Plugins. Once installed on your local computer, you can use it to see all type of information inside of RTMT, including gateway utilization, registered and unregistered devices, etc.
Packet captures with Cisco RTMT
On to why we are all here – how to use the Cisco RTMT to download raw trace files onto our local computer. Once the trace logs are saved locally, they can either be provided to support, or further processed with another tool.
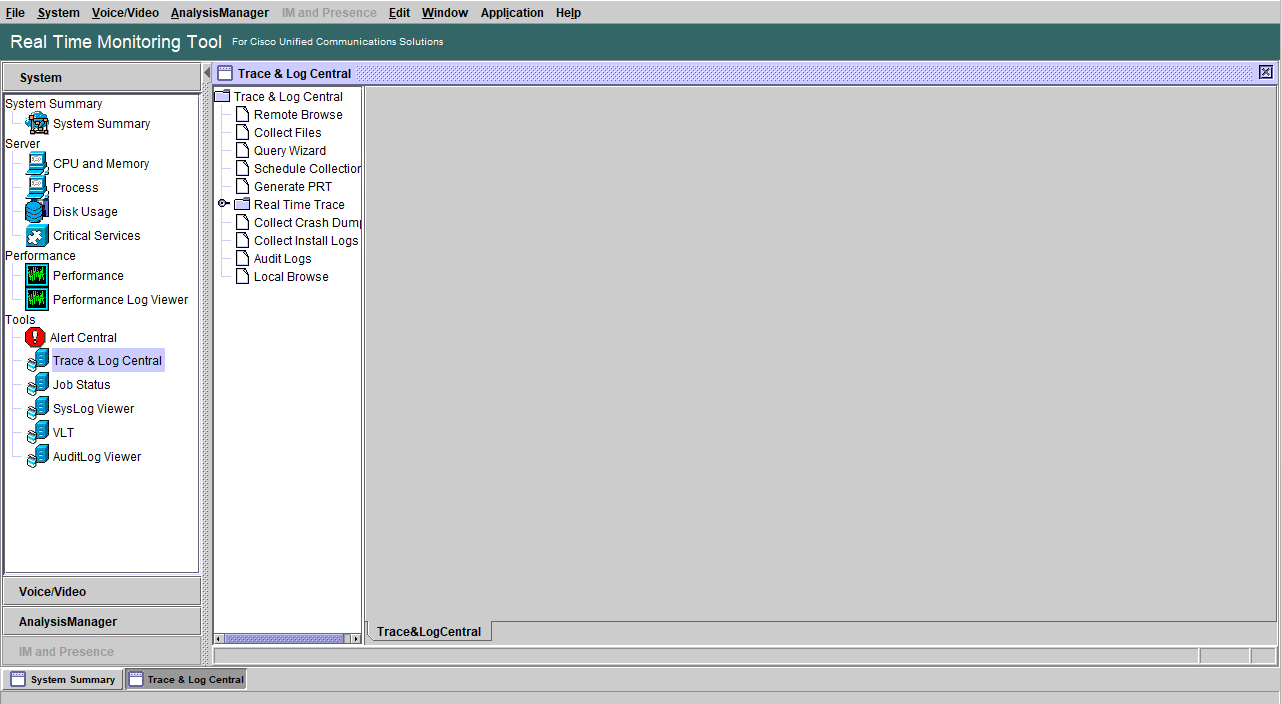
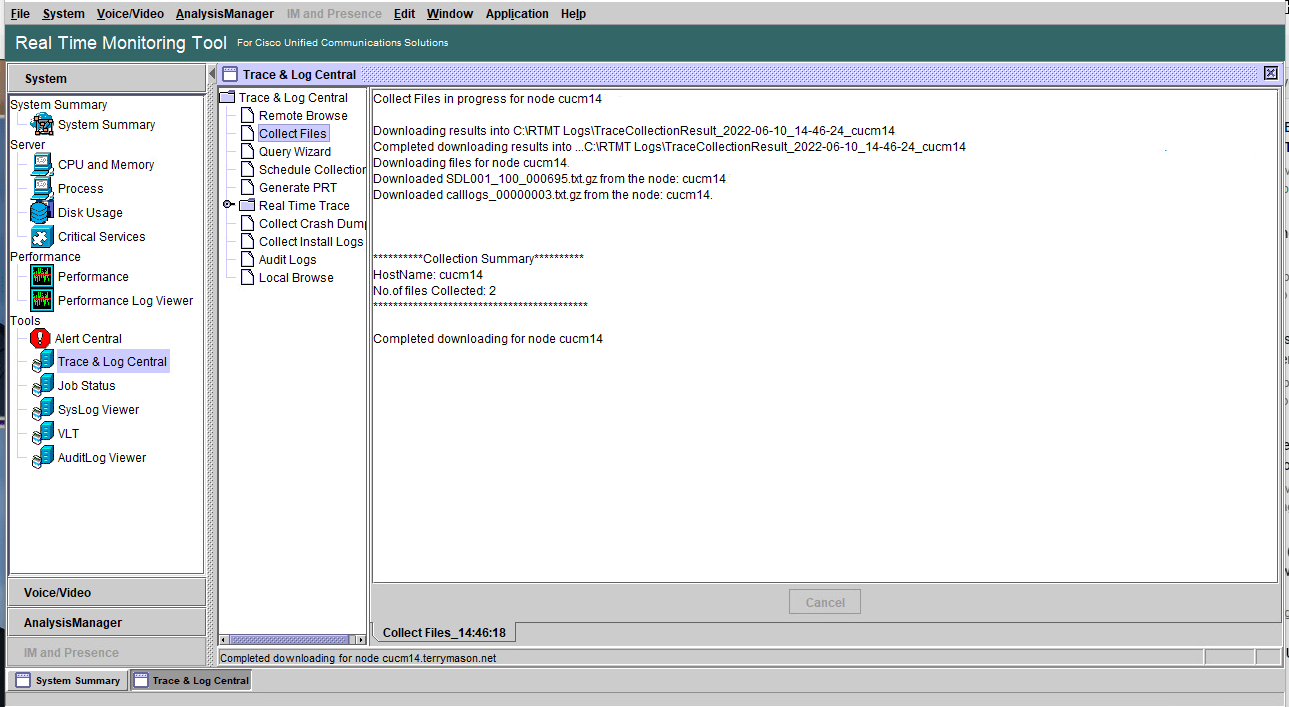
Launch the Cisco Unified Real Time Monitoring Tool, and go to System -> Trace & Log Central
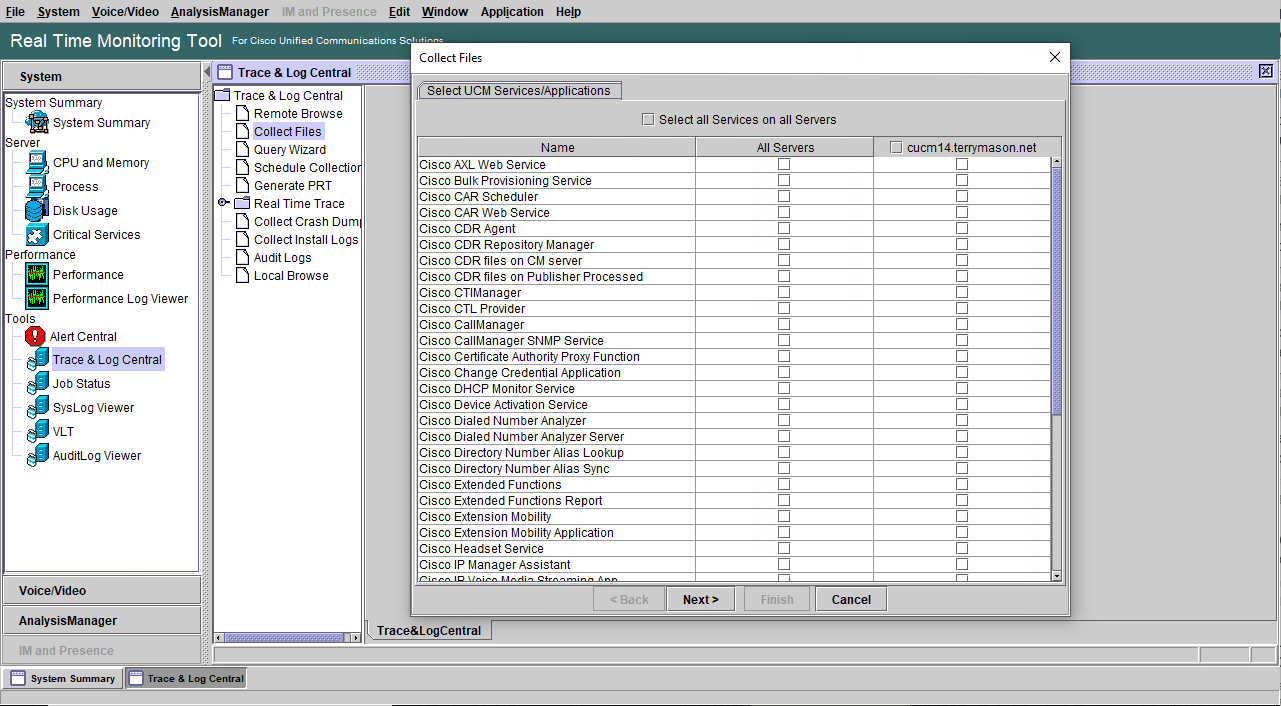
In the right panel, double click on “collect files”. A popup will appear.
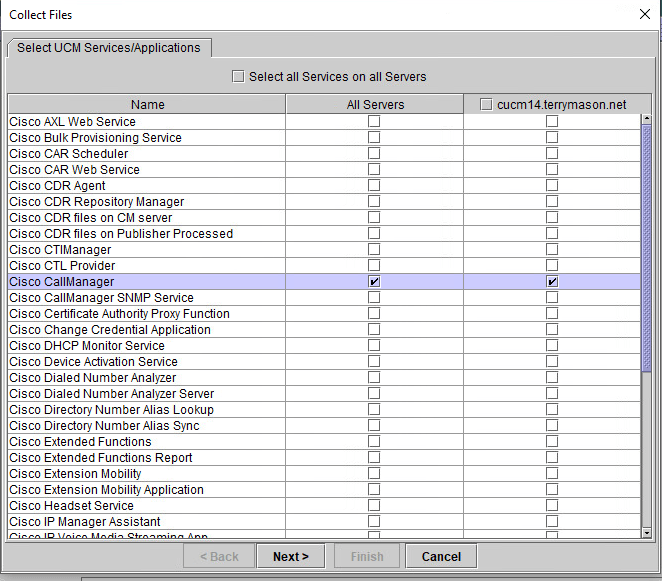
In the popup, find the “Cisco CallManager” row, and select the “All Servers” column. This means that we will download the Cisco CallManager traces from all nodes in the Call Manager cluster. Press the Next button.
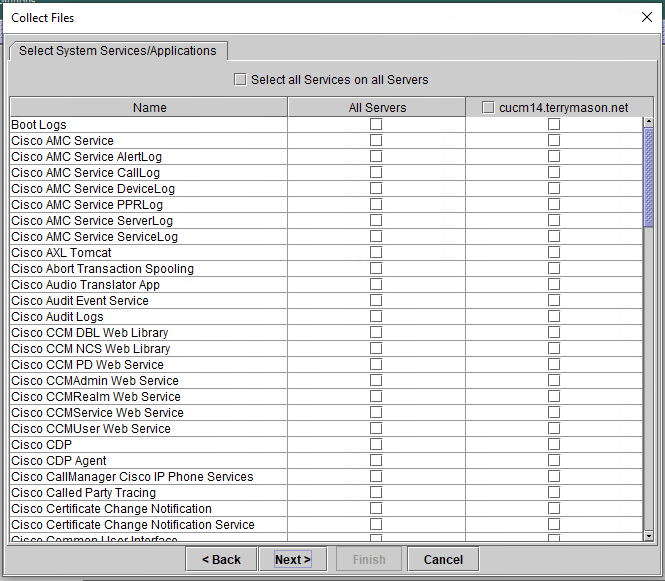
No need to choose any services on this panel, so press Next.
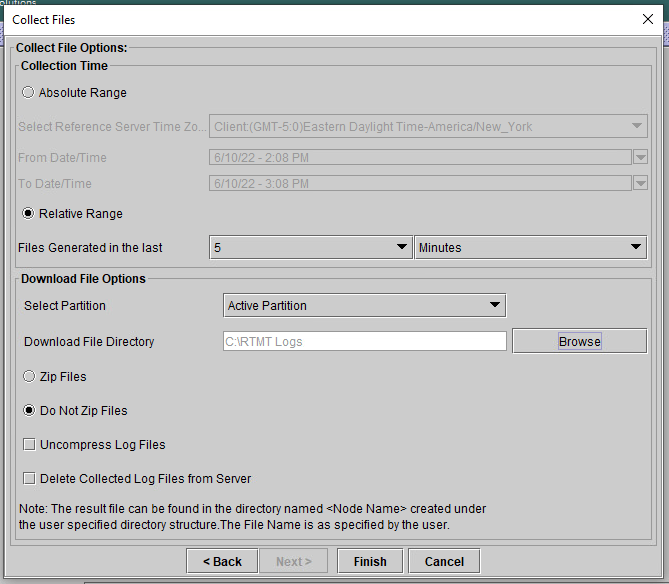
For the time frame, you can pick the time that reflects when the test call was made. In this case we will choose a “Relative Range” of 5 minutes, since the test call was made in the last 5 minutes. Press the Browse button next to “Download File Directory”, and choose an empty directory where you would like the files to be downloaded to. Leave all other settings at their defaults, and press finish.
RTMT will download all logs from each node in your cluster, and save them to the folder specified.
Now, we can see the logs in our folder, ready to provide to Cisco TAC, or to process in another tool, like TranslatorX
Finding calls with errors
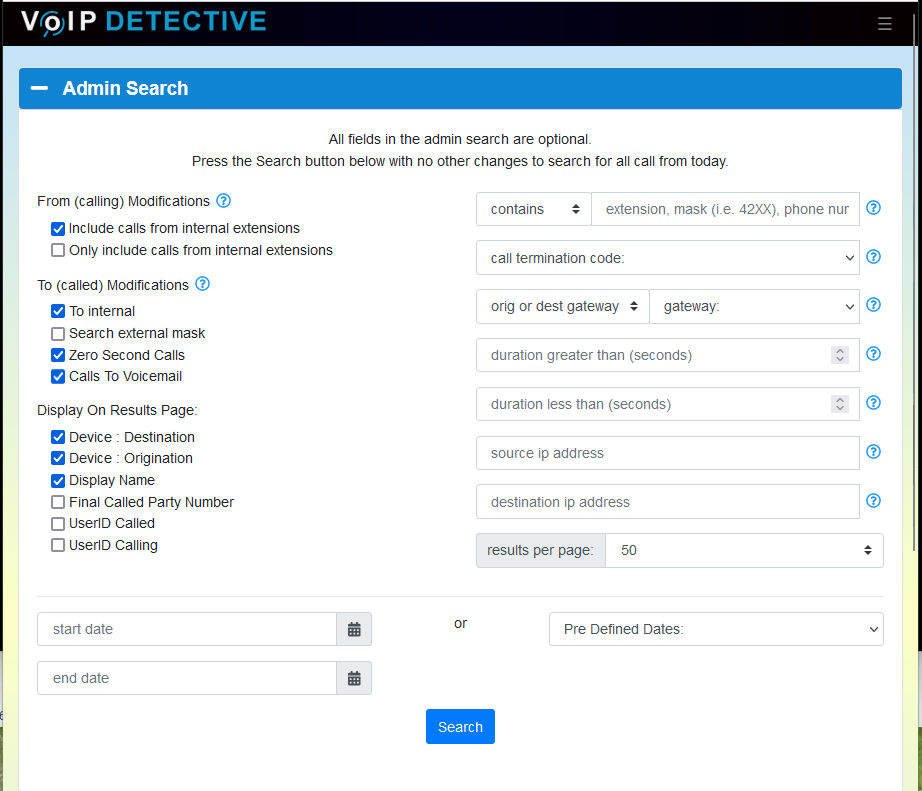
If users have complained of calls with errors, but have limited information or no information about the date, time, or parties involved, it can be very difficult to locate this call in the RTMT logs. Luckily there is another free tool that can help us zero in on these calls. VoIP Detective, our free CDR tool can isolate error calls with only a few clicks. If you need sample calls to investigate, or to provide to Cisco support, you can use VoIP Detective to locate the time, date and involved parties.
Start by going to the Admin Search (Track Calls -> Admin Search).
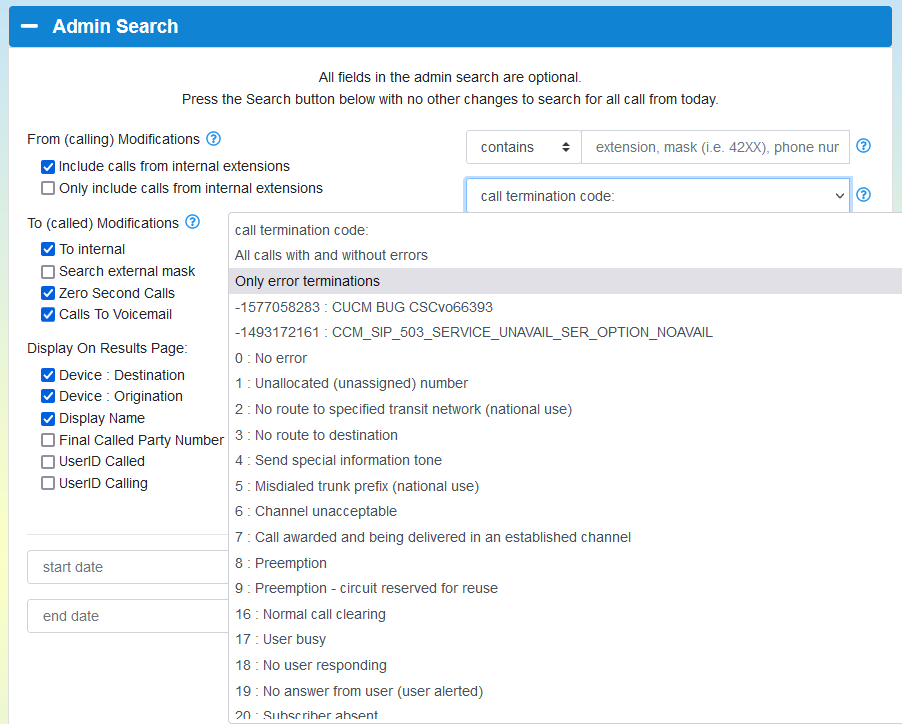
We can then use the “call termination code” field to either look for a specific SIP error code, or search for all SIP errors
Searching for all error codes from today resulted in the following two error calls, both of which resulted in a termination code of 27 (Destination out of order).
Now that we’ve isolated an error call that we would like more information on, we could use RTMT to pull trace logs from a the time that call occurred. VoIP Detective can isolate the calls you are after, so looking for errors is no longer like finding a needle in a haystack.

